
ECOM+45+
Questionnaire
analysis, e-Seniors (France)
Introduction
As a first phase of the Project ECOM 45+, a survey was
organised in each of the partner organisations. This survey concerned with the
perception that the target population, people aged 45+, have nowadays about the
relevance of ICT and E-working in their lives and about the way in which ICT
can improve their quality of life and professional skills. The graphs presented
hereafter describe the results of this survey as regards the French partner of
ECOM+45+, the Ile de France based organisation, e-Seniors.
One hundred and two persons answered the questions proposed
to them. A majority of them are either retired or unemployed. The questions try
to address the general expectations and motivations centred on ICTs.
Several uses can be made of these results, but the
most interesting ones are certainly those which will help define a “training
offer” designed to improve the main aspects of seniors’ daily preoccupations
(not ranked here by order of priority):
- social environment (family,
friends, carers, etc.)
- maintaining or improving revenue, where and when applicable, either
by direct increase (better job qualification, setting up complementary
activities, etc.) or indirectly by finding better commercial deals
(e-Shopping, on line travel bookings, etc.)
- health: information and resources on prevention and healthcare
- cognitive fitness
- entertainment
- etc.
Demography and personal
data (incl. occupation)
Demography
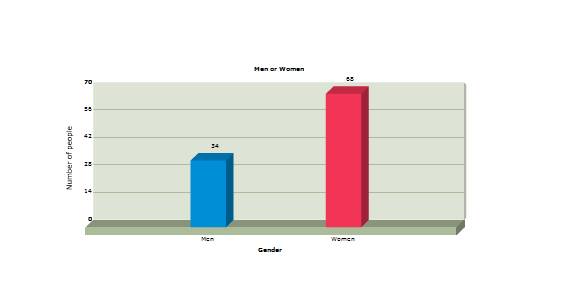
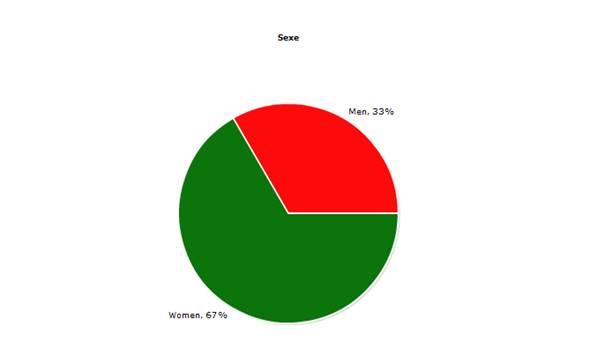
Out of 102 persons who filled in the questionnaire, two thirds (67%) are females and one third is males (33%). This result is not too far from the general result for all institutions taken together (71% female with 29% males).
Marital status and
personal questions
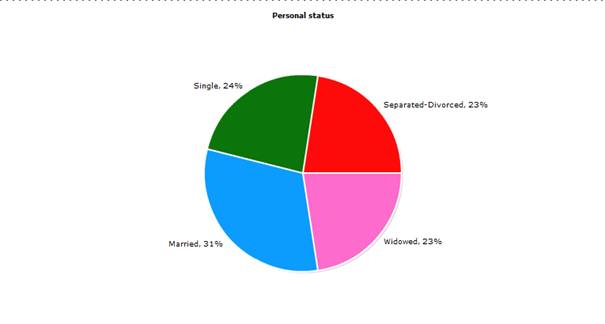
The marital/personal status over the studied answers is clearly broken down into four categories, of which three have approximately the same weight: apart from the married population, representing 31%, the three other categories, are nearly equal in weight. Singles, separated or divorced and widowed, each account for about 23-24%.
Compared with the same statistic over the entire international group, in which the <married> population represents 55% a difference can be noted.
We can state, looking at the graphic below, that the age of the responders varies and spreads from 50+ to 89 (with an exception of 41 years old) with a feminine majority. This public is not very familiar with the technology, which can explain several issues in the analysis.
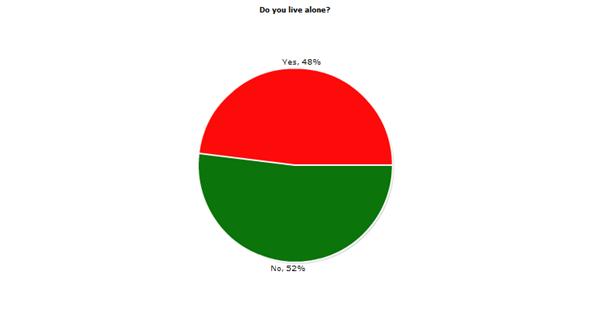
Interestingly, whereas over the global study in which 70% of the respondents declared living with a companion, the figures for the e-Seniors questionnaire show a substantial difference: only 52% declared not living alone.
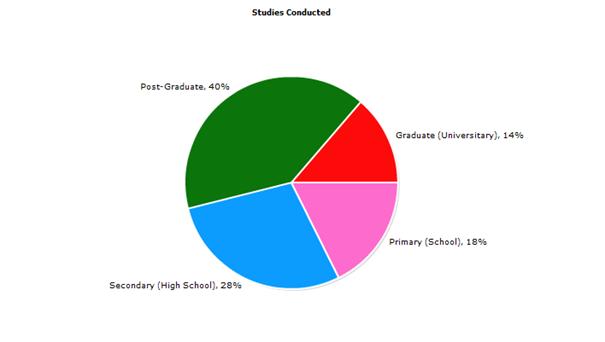
Academic qualifications
Fifty four percent of respondents to e-Seniors’questionnaire have at least one university degree (54%). A small proportion finished only primary school (18%). This data is useful for taking into account background knowledge, potential motivations and capacity to understand and use both tools and media contents.
Current activity
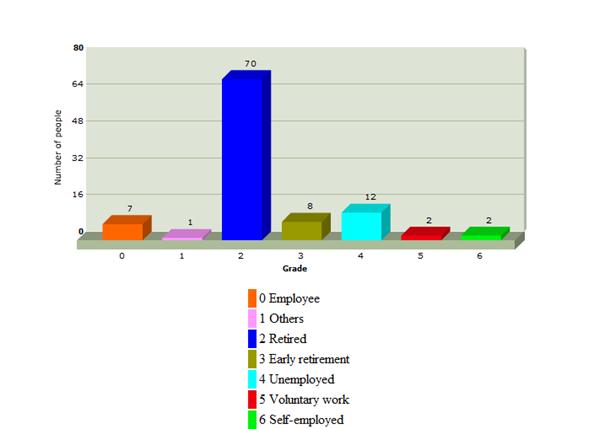
Expectedly, the two largest categories are represented by retirees (70/102) and unemployed persons (12/102), followed by persons who took so-called “early retirement” (8/102) often, in France, an intermediary status between unemployed and retiree. Until recently, regulations just changed in September/October 2009, “Early retirement” does not always describe somebody’s situation further to a decision made to leave working for personal reasons, but rather an employer’s decision to lay out, in a supposedly “clean manner”, elder employees, either for financial or competency reasons. Therefore, to a certain extent, the three categories can be grouped together, ie 90 people out of 102 are without formal occupation. Now, out of the 70 retirees, not all may still be in age of conducting a regular job activity. And a more accurate view would be to group the so-called early retirees with the unemployed, adding a few persons of the retiree group (blue bar on chart) able to hold (or wanting/needing) a job.
Interest and motivation
Need to learn how to use
ICTs
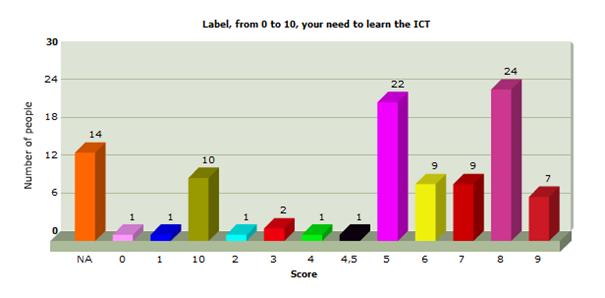
The distribution of answers in the chart above, with its spread diversity, lets realise that, out of the 102 persons who filled in the answer to the questionnaire, 34, ie more than a third, sense a strong learning need. Adding to this third, about a fifth, 22 people, also averagely sense a need. The disturbing figure in this question is constituted by the 14/102 who either express no opinion about this need, or simply just don’t know.
Looking at the nevertheless different consolidated figures similar conclusions are to be drawn, like, surprisingly, with 38 “NA” out of the total, and a large majority of persons feeling a need for learning. In both statistics, a minority of respondents with apparently littlee need for learning can be seen.
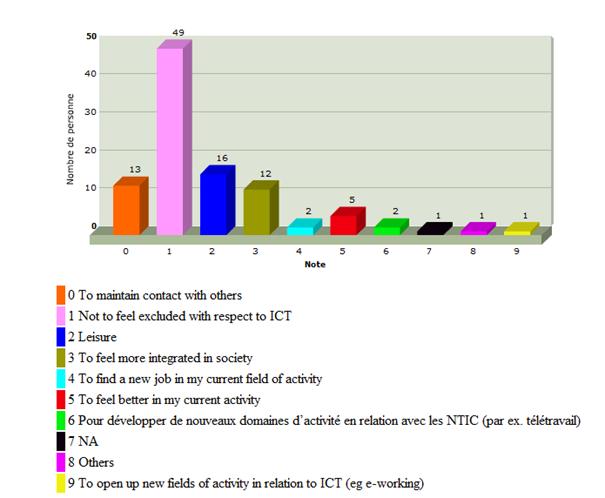
Interest in ICTs
Both charts below represent where the respondents’ interest in ICTs lies. The subjects assessed have been ranked from the highest score, 49/102, (Not to feel excluded with respect to ICT) to the lowest score (NA; others; e-working). It would be interesting to develop what the respondents read/understood under “leisure”, the point is this heading scored second. Social links/attachment to society scored third: (13+12)/102.
ICTs in Practice
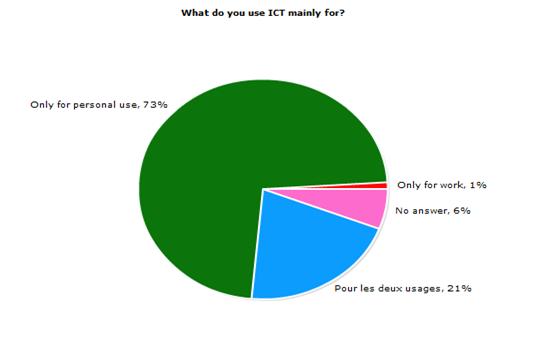
Main uses of ICTs
The two major answers are “only for personal use”, 73%, and “for both personal and professional use”, 21%, which together represent 94%. Yet, the “personal use” answers largely predominate.
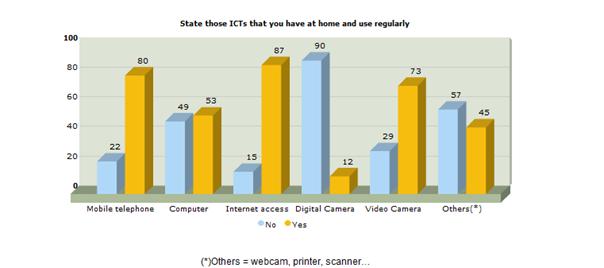
ICTs available at home and used regularly
This was a no/yes kind of question. Apart from the case
of computers where “yesses” shortly supersede “nos” by a short distance (this
is partly explained by the fact that students have access to computers during
ICT courses), “yesses” are generally massive, as is the case with mobile phones
(nearly 80%), with Internet access nearly 87%), with video cameras (nearly
73%); is there a misunderstanding with the definition of “digital cameras”, for
which “nos” score nearly 90% ? Or has it been assumed that most pocket
digital cameras also include a video filming capability ? In the “others”
section “nos” supersed “yesses” with only a 12 point difference.
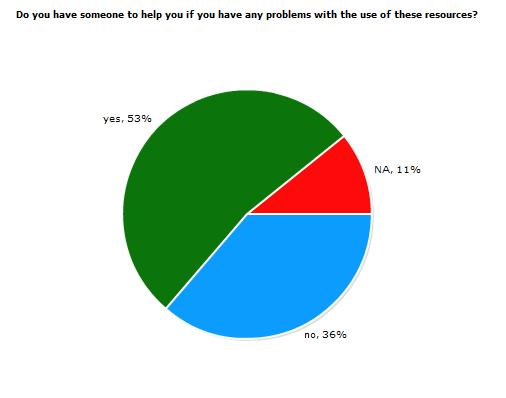
Support
Fifty three percent of responders declared having the possibility to resort to somebody for help, whereas 36% declared they don’t have this possibility.
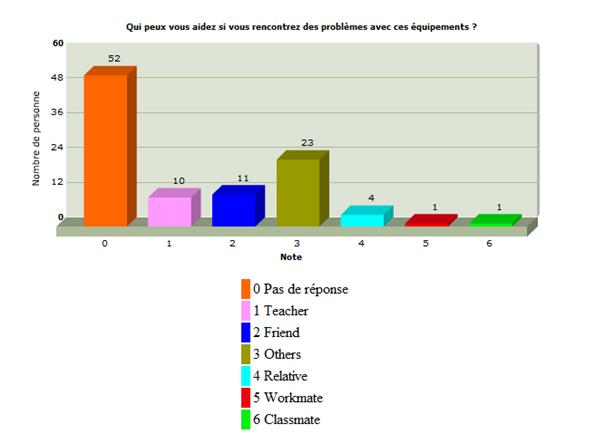
Who will help ?
Answers to the “Can you count on someone to help you if you have problems when using the ICTs ?” question, are surprising when compared with the previous ones: 52 out of 102 give no answer and 23/102, reply “others”. Only 21 out of 102 will depend on teacher or friend. This denotes a clear need for education or training on support and trouble spotting.
What do you use your PC
for ?
Most of the seniors are using the computer for three major activities – word processing, Internet, and photo retouching (this is not surprising as classes in this activity are available for e-Seniors students), showing that more complex ICT activities are now being undertaken by seniors. On the other hand banking/accounting applications don’t have the favour of seniors.
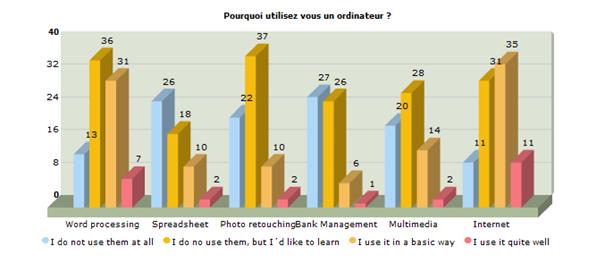
Discussions “off the record” and informal conversations beside the questioning campaign have shown that many seniors are afraid of phishing, spyware, etc., and more generally require information on how to use Internet securely, especially as regards e-banking and e-shopping, ticket bookings, etc., confirming these figures. This may perhaps lead to design, for seniors, courses dealing with subjects such as basic safety/security behaviours for Internet users, with the double benefits of explaining better how things work and relieving stress while using on line services, and, expanding the usage of safer Internet.
Figure
14. Uses of Internet (E-Seniors,
Very few users have claimed to be using the different applications as basic user or experts, this is quite comprehensable regarding the fact, that many of them got to know these applications and services only at a late stage.
However, there is quite a big portion of the users who is interested in learning how to use or “do” things on the internet, which show a certain openness and understanding that it has benefits.
Time spent on the computer
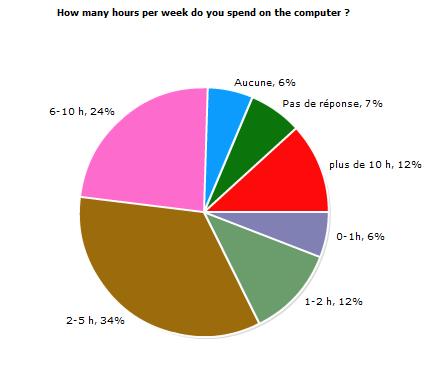
Let apart the 12% of respondents declaring to spend over 10 hours per week on their computer, the usual practice duration seems to span between one hour and ten hours per week, with a strong portion of the respondents spending two to five hours every week on their machine. In a future study, it would be interesting to correlate this data to the personal and marital status of the respondents; to find out whether having a companion in life induces differences in the time spent on the computer. Time spent should also be measured against the number of applications and services used by the respondent.
Time spent on the Internet
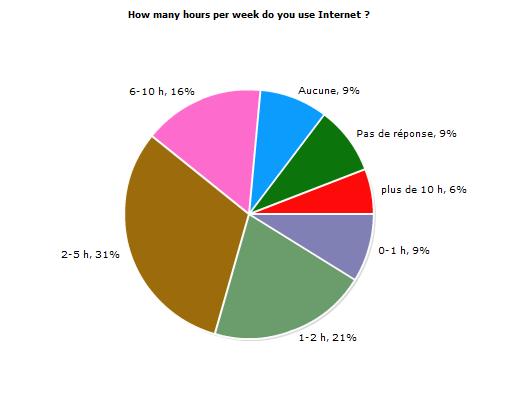
Quite logically, less respondents answer to the same time spans for Internet. Although one may think that time dedicated to Internet may only be a share of the time spent with the computer, it is risky to make assumptions on the comparison of both figures, each one having to be taken separately, it seems.
Benefits of the Internet
Most of the senior users don’t feel enough secured and sure of them self regarding the benefits of the use of internet.
The reason for this negative perception could come from the fact that they are not yet used to live on the internet and operate in distance as the younger generations are.
We must emphasise that our responders are mostly at the age of pension, therefore are not that concerned with e6working.
However, it is possible that, if we will get them more acquainted with the intenet through demonstration that will make it easier to view the benefit and therefore understand, they will change their perception to a more positive one.